Laser scattering microscopy
The hunt for pre-nucleation clusters in solution
The limits of resolution for classical optical microscopy are typically on the scale of the wavelength of light used (500 nm). Modern optical microscopy has developed many sophisticated variations to circumvent limits on resolution. Fluorescence techniques can now image and track single molecules by tagging them with fluorescent groups. What if you can't attach a fluorescent group to the species you are interested in? Our group's rationale for developing laser scattering microscopy was to image clusters of solute that are thought to be the precursors to crystal nucleation. Fluorescence and Raman spectroscopy techniques are not suitable due to overlap with background signal of individual molecules or 'monomers'.
The limits of resolution for classical optical microscopy are typically on the scale of the wavelength of light used (500 nm). Modern optical microscopy has developed many sophisticated variations to circumvent limits on resolution. Fluorescence techniques can now image and track single molecules by tagging them with fluorescent groups. What if you can't attach a fluorescent group to the species you are interested in? Our group's rationale for developing laser scattering microscopy was to image clusters of solute that are thought to be the precursors to crystal nucleation. Fluorescence and Raman spectroscopy techniques are not suitable due to overlap with background signal of individual molecules or 'monomers'.
Why is this hunt important?
It is important to know the structure and dynamics of a solution before it first nucleates and crystallizes, so that we better understand the mechanism. Computational evidence for pre-nucleation clusters is relatively new. Our results, outlined below, provide the first evidence for solute clusters through direct in situ scattering measurements.
It is important to know the structure and dynamics of a solution before it first nucleates and crystallizes, so that we better understand the mechanism. Computational evidence for pre-nucleation clusters is relatively new. Our results, outlined below, provide the first evidence for solute clusters through direct in situ scattering measurements.
Laser scattering microscopy for imaging solution structure
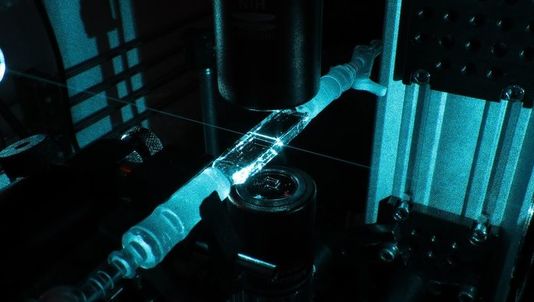
In collaboration with colleagues (Andy Ward and Stan Botchway) at the STFC Lasers for Science Facility, we have built laser scattering microscopes for imaging small (< 50 nm) particles. By passing an intense (> 10 mW) continuous wave (CW) laser beam through the solution, we are able to detect clusters by Rayleigh scattering or second harmonic scattering. This can be seen in the image below, where the blue laser (488 nm) is passed through a quartz glass cuvette. A long-working distance microscope objective is used to image the scattering events.
In collaboration with colleagues (Andy Ward and Stan Botchway) at the STFC Lasers for Science Facility, we have built laser scattering microscopes for imaging small (< 50 nm) particles. By passing an intense (> 10 mW) continuous wave (CW) laser beam through the solution, we are able to detect clusters by Rayleigh scattering or second harmonic scattering. This can be seen in the image below, where the blue laser (488 nm) is passed through a quartz glass cuvette. A long-working distance microscope objective is used to image the scattering events.
|
|
Second harmonic scattering microscopy
We built a variation of the Rayleigh scattering microscope that uses confocal technique to excite second harmonic scattering. The input light is at 800 nm (180 fs pulses); the second harmonic of the back-scattered light at 400 nm is detected. The cell is placed on an X-Y translation stage to enable us to raster scan through the solution.
We built a variation of the Rayleigh scattering microscope that uses confocal technique to excite second harmonic scattering. The input light is at 800 nm (180 fs pulses); the second harmonic of the back-scattered light at 400 nm is detected. The cell is placed on an X-Y translation stage to enable us to raster scan through the solution.
|
|
Why study urea? What do we see?
The solution that we studied was aqueous urea. Urea only has one polymorph, which crystallizes in a non-centrosymmetric space group. Therefore, if clusters of solute are crystalline or nearly crystalline we might expect to see a large second-harmonic generation signal (above image). We saw large spikes in the collected signal as we scanned the focal volume through the cell (pathelengths of microns). This indicates that there are rare species in solution that give a signal. Similar experiments on dispersions of barium titanate nanoparticles, which are known to be SHG-active, give similar results.
The solution that we studied was aqueous urea. Urea only has one polymorph, which crystallizes in a non-centrosymmetric space group. Therefore, if clusters of solute are crystalline or nearly crystalline we might expect to see a large second-harmonic generation signal (above image). We saw large spikes in the collected signal as we scanned the focal volume through the cell (pathelengths of microns). This indicates that there are rare species in solution that give a signal. Similar experiments on dispersions of barium titanate nanoparticles, which are known to be SHG-active, give similar results.
First direct detection of solute clusters?
So we see particles in solution, as detected using second harmonic scattering. How do we know they are solute clusters? By conducting time-integrated measurements we see an unusual dependence of second harmonic signal on solution concentration. In particular there appear to be increases in the signal at supersaturation (S = 1.0) and above (S = 1.75) which might indicate changes in the solution structure to accommodate the additional solute.
So we see particles in solution, as detected using second harmonic scattering. How do we know they are solute clusters? By conducting time-integrated measurements we see an unusual dependence of second harmonic signal on solution concentration. In particular there appear to be increases in the signal at supersaturation (S = 1.0) and above (S = 1.75) which might indicate changes in the solution structure to accommodate the additional solute.